1800 121 5955

The ROI of UX design compares the financial benefits attributable to an improvement with the cost of delivering it over the same period. Calculate it as (attributable benefits − total investment) ÷ total investment × 100. The difficult part is establishing the benefits, not applying the formula.
A redesign may improve completion rates or reduce handling time, but those changes do not automatically become profit or cash savings. Product leaders need a baseline, a credible comparison and an agreed way to convert operational changes into financial value.
This guide provides a practical measurement approach for customer journeys and internal enterprise tools. It separates observed outcomes, forecasts and assumptions so that a business case can be reviewed rather than simply believed.
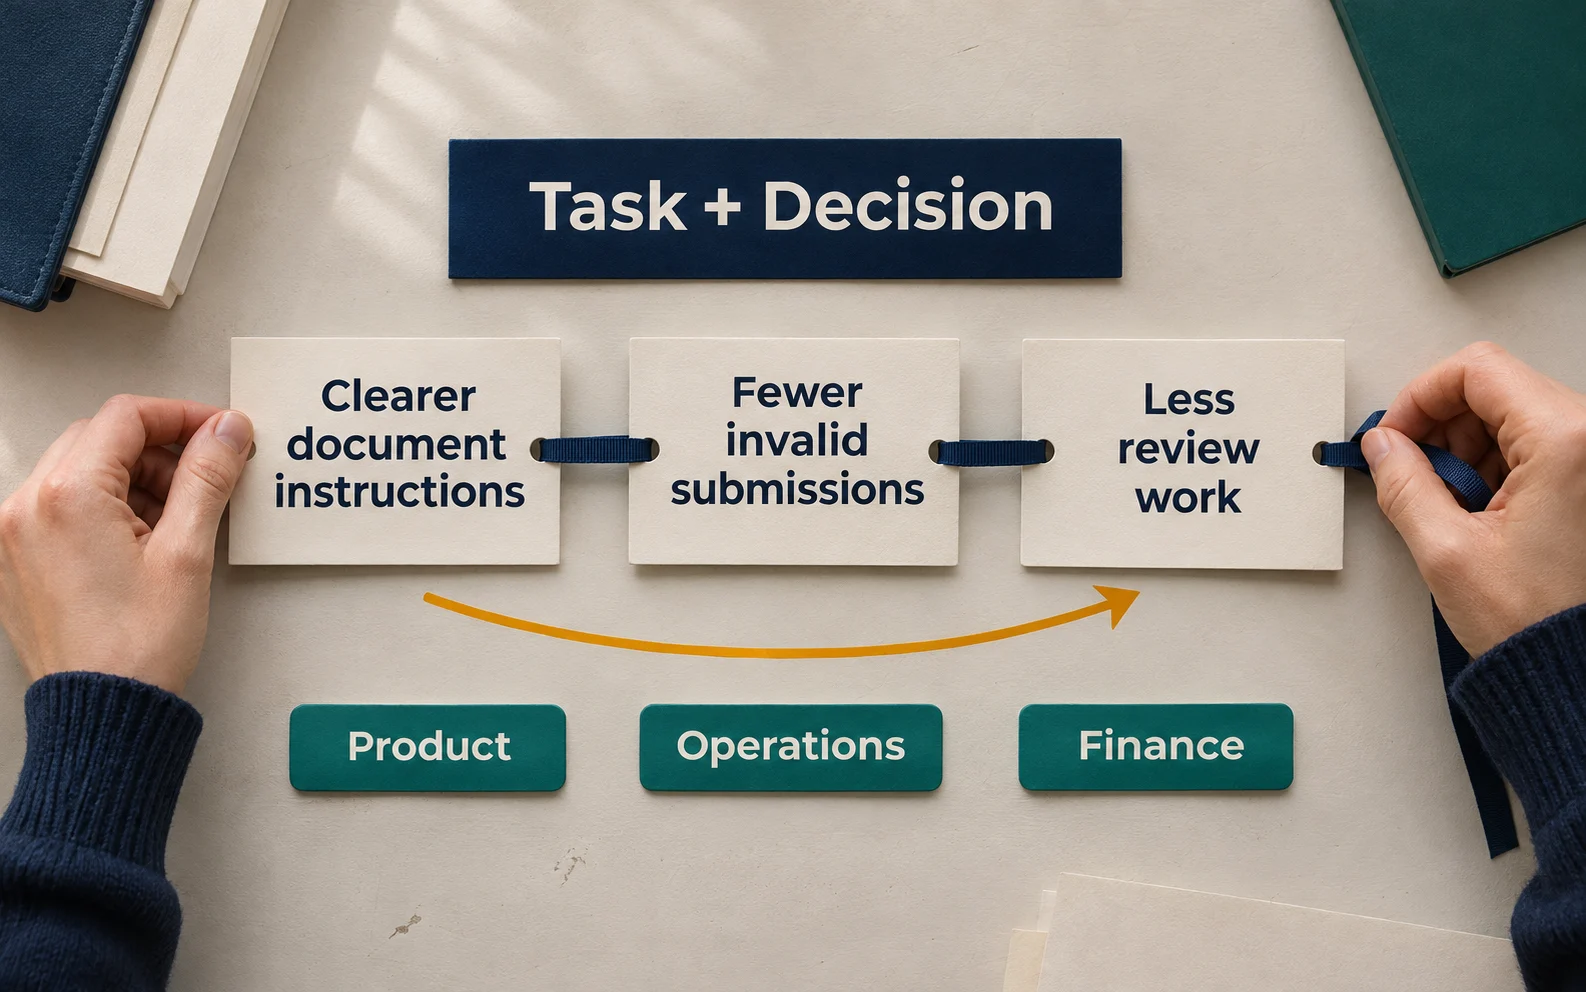
Start with a task and a decision
Choose a specific workflow, such as submitting an application, resolving a service request or finding an appointment. Define what successful completion means and which users are eligible to attempt it.
Connect the proposed UX change to a measurable hypothesis. For example: clearer document instructions may reduce invalid submissions, which may reduce review work. Each link needs evidence. A reduction in errors does not establish a reduction in staffing cost unless the organisation can realise that saving.
Assign an owner to each baseline. Product analytics may track completion, operations may own handling time and finance may supply an appropriate cost rate. Agree definitions before release so that teams do not select whichever metric looks favourable afterward.
Separate the benefits you can measure
| Benefit category | Measurement approach | Important qualification |
| Incremental contribution | Additional attributable completions × contribution per completion | Revenue is not contribution; subtract relevant variable costs |
| Operating capacity | Tasks completed × time saved per task | Time released is not automatically cash saved |
| Support cost | Attributable contacts avoided × avoidable cost per contact | Fixed costs may remain even when volume falls |
| Rework avoided | Attributable rework hours avoided × agreed labour cost | Use a credible comparator and avoid overlapping benefits |
| Risk exposure | Change in probability and impact under an approved model | Keep uncertain scenarios separate from realised savings |
Use the same reporting period and currency across the calculation. If a project spans several years, finance should determine whether discounted cash-flow analysis is needed. A simple undiscounted ROI percentage is not a substitute for that analysis.
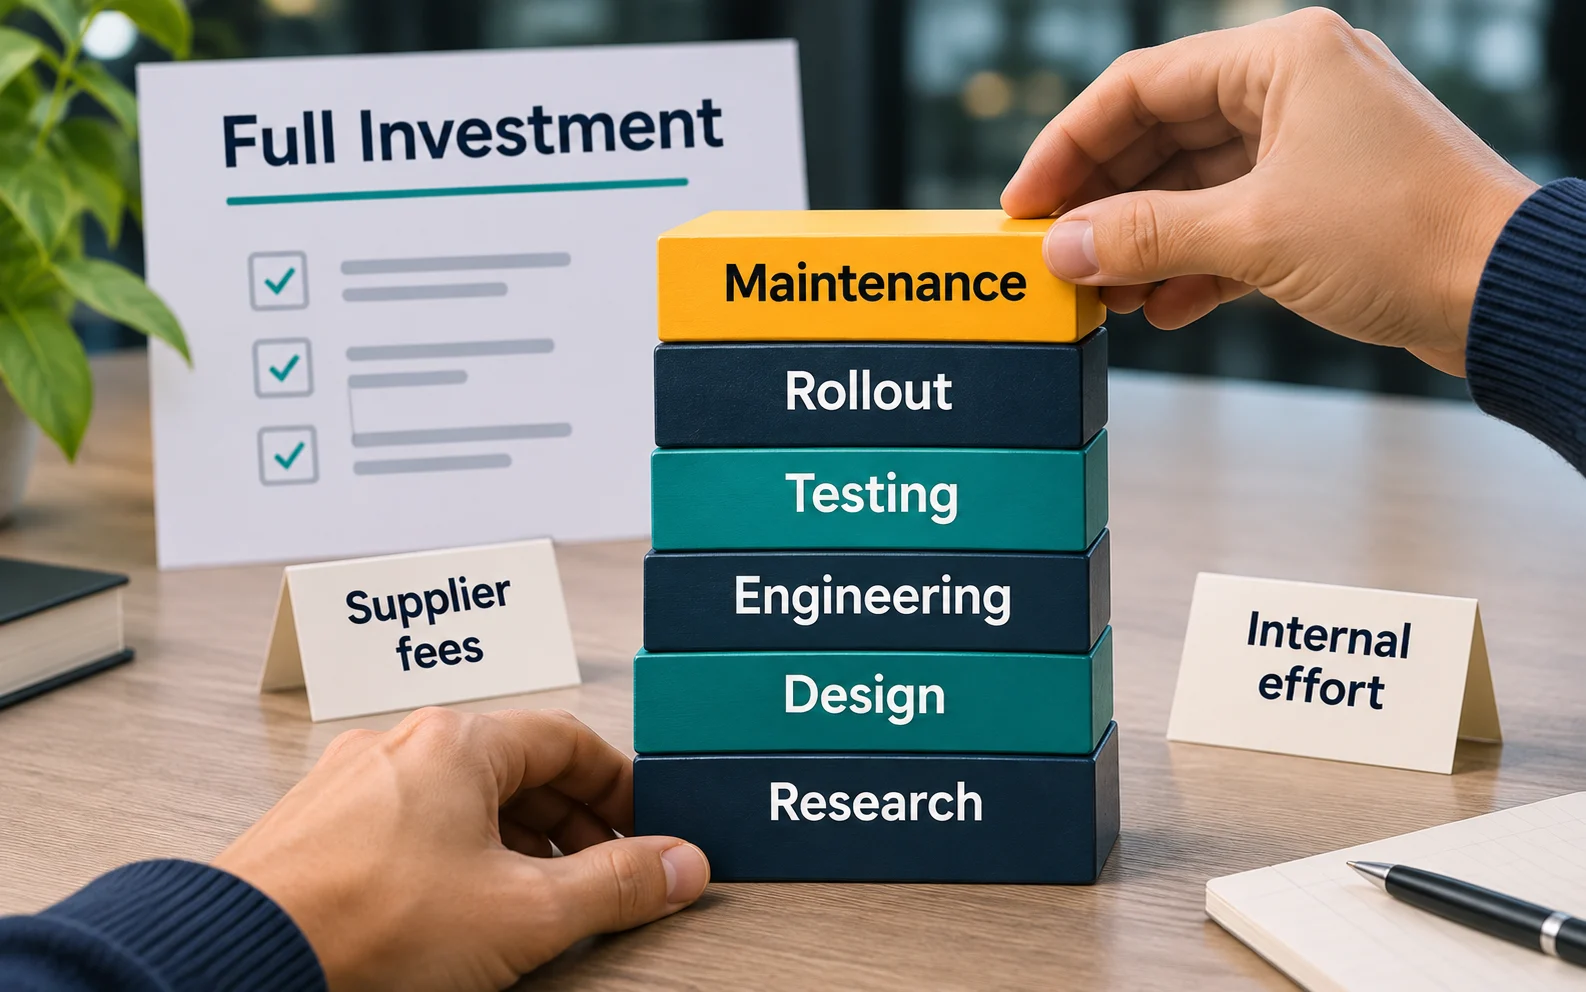
Include the full investment
Count the work needed to achieve the outcome: research, recruitment, design, engineering, testing, instrumentation, rollout, training and relevant maintenance. Include internal effort as well as supplier fees when comparing the full resource investment.
Be clear whether you are measuring the return on a complete product change or on an incremental UX intervention. If engineering and policy changes are essential to the result, do not attribute all benefits to visual design while excluding those implementation costs.
For recurring initiatives, distinguish the initial investment from ongoing costs. A benefit that depends on continuing support should not be compared only with the first design invoice.
A worked example with transparent assumptions
The following numbers are fictional and illustrate a twelve-month evaluation. They are not a ScreenRoot client result or a promised return.
Assume a team redesigns an internal processing task. During the measurement period, the improved workflow handles 24,000 completed tasks. A credible comparison estimates a net saving of three minutes per task, with no deterioration in accuracy.
| Input or calculation | Illustrative value |
| Time released | 24,000 × 3 ÷ 60 = 1,200 hours |
| Loaded labour value | INR 800 per hour |
| Gross capacity value | 1,200 × INR 800 = INR 9,60,000 |
| Assumed proportion usefully redeployed | 50% |
| Recognised capacity value | INR 4,80,000 |
| Separate avoidable external support cost | INR 1,20,000 |
| Total recognised economic benefit | INR 6,00,000 |
| Research, design, build and rollout investment | INR 5,00,000 |
| Economic ROI | (6,00,000 − 5,00,000) ÷ 5,00,000 = 20% |
The 20% figure includes redeployed capacity. If the INR 1,20,000 support reduction is the only realised cash saving, the cash-only ROI on the same assumed INR 5,00,000 cash investment is −76%. Both views can be useful, but they answer different questions.
At 25% capacity realisation, recognised benefits would be INR 3,60,000 and economic ROI would be −28%. At 75%, benefits would be INR 8,40,000 and ROI would be 68%. Showing this sensitivity makes the role of the assumption visible.
The support saving must concern work outside the measured processing time. Otherwise, the calculation counts the same improvement twice. If benefits ramp up after launch, use the actual monthly pattern rather than assuming a full year at steady-state performance.
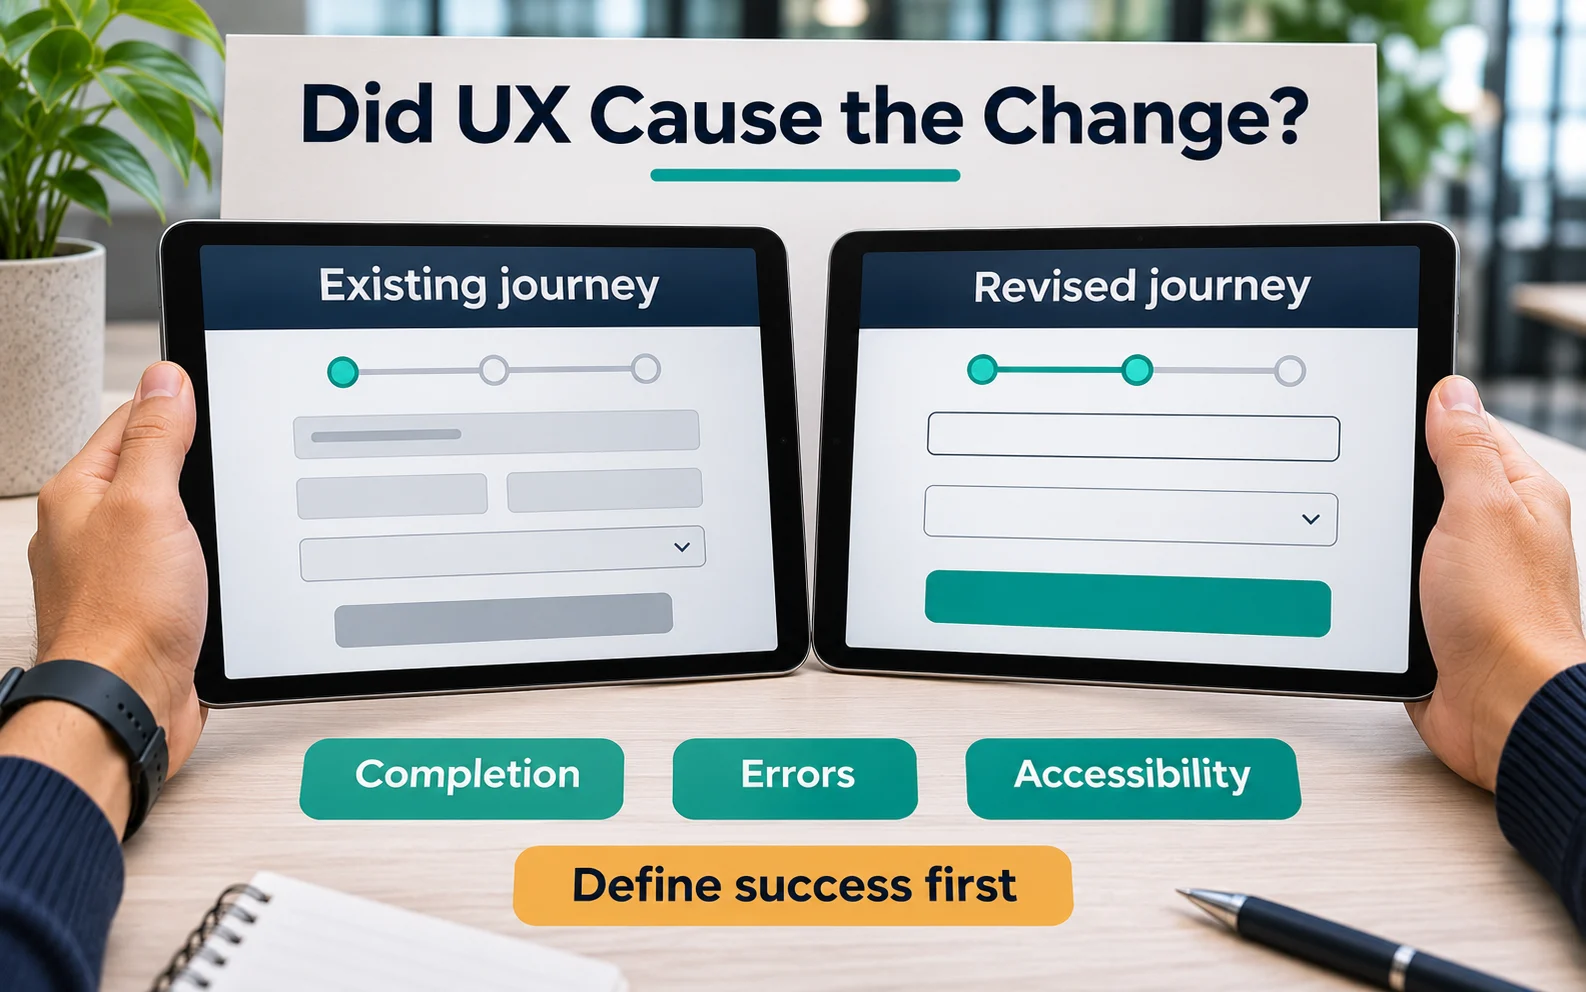
Establish whether UX caused the change
Where appropriate, compare randomly assigned groups experiencing the existing and revised journeys. Define the success measure, observation period and guardrails before the test. Do not knowingly expose users to a harmful or unlawful flow to preserve an experiment.
If randomisation is impractical, use a phased rollout, a reasonably comparable group or a before-and-after analysis that records concurrent changes. Pricing, marketing, traffic mix, staffing and backend performance can all affect the result. Describe such evidence as an association when it cannot establish causality.
Report the number of observations, important segment differences and uncertainty. A faster average task time is not a sufficient result if a minority of users can no longer complete the task. Pair speed with completion, error severity and accessibility findings.

Use case studies to generate hypotheses
ScreenRoot’s Experian case study describes factor-level explanations and contextual guidance in a credit-score portal. Those decisions suggest testable questions about comprehension and task completion. The public page does not provide the investment and attributable financial benefits required to calculate ROI.
Similarly, ScreenRoot’s YES BANK project describes navigation changes and highlighted banking tasks. That is evidence of design scope. A financial return would require additional client data and an appropriate comparison.
This distinction matters when using any agency portfolio. A usage milestone, award or favourable testimonial is not an ROI calculation.
Avoid headline multipliers as budget assumptions
A frequently repeated historical benchmark comes from Nielsen Norman Group’s 2008 usability research, which reported an average 83% improvement in surveyed business metrics after redesign. That finding does not guarantee an 83% conversion increase for a current project.
The same caution applies to universal claims about fixes costing 100 times more after release. Early validation can identify problems before implementation, but the actual cost difference depends on the issue, product and delivery process. Use your own rework records instead of treating a slogan as a forecast.

Build a measurement plan that survives launch
Record the hypothesis, baseline, data source, comparison method, investment and reporting owner in one plan. Add expected benefits as a range, state the assumptions and document when they will be reviewed.
After release, reconcile observed outcomes with the original forecast. Explain what changed, what remains uncertain and whether the next investment should continue, change direction or stop. Negative results are useful when they prevent repeated spending on the wrong intervention.
Questions about measuring UX ROI
Can usability testing prove financial ROI?
It can identify usability problems and measure task performance under test conditions. Financial ROI also requires implementation costs, real-world outcomes and credible attribution.
Is employee time saved a cost saving?
It is initially a capacity measure. It becomes a cash saving only when spending is avoided or reduced. Redeployment can have economic value, but state that assumption separately.
What if the baseline is missing?
Establish one before a major rollout where possible. If that is no longer possible, use the best available comparison and disclose its limitations rather than inventing precision.
Start with a measurable workflow
ScreenRoot’s usability testing service can support investigation of user interactions and task difficulties. Bring a priority journey, available baseline data and the decision you need to make to discuss a focused evaluation.
Written by Team ScreenRoot. 16+ years leading enterprise UI/UX research for BFSI, SaaS, and Healthcare clients.
When you’re ready, let’s talk.
📞 Call us (Toll-Free): 1800 121 5955 (India)
✉️ Email us: [email protected]